
A Salad That Beats Fast Food: Nutrient Density vs Calories
Today I made a simple lunch using ingredients already sitting in my kitchen.
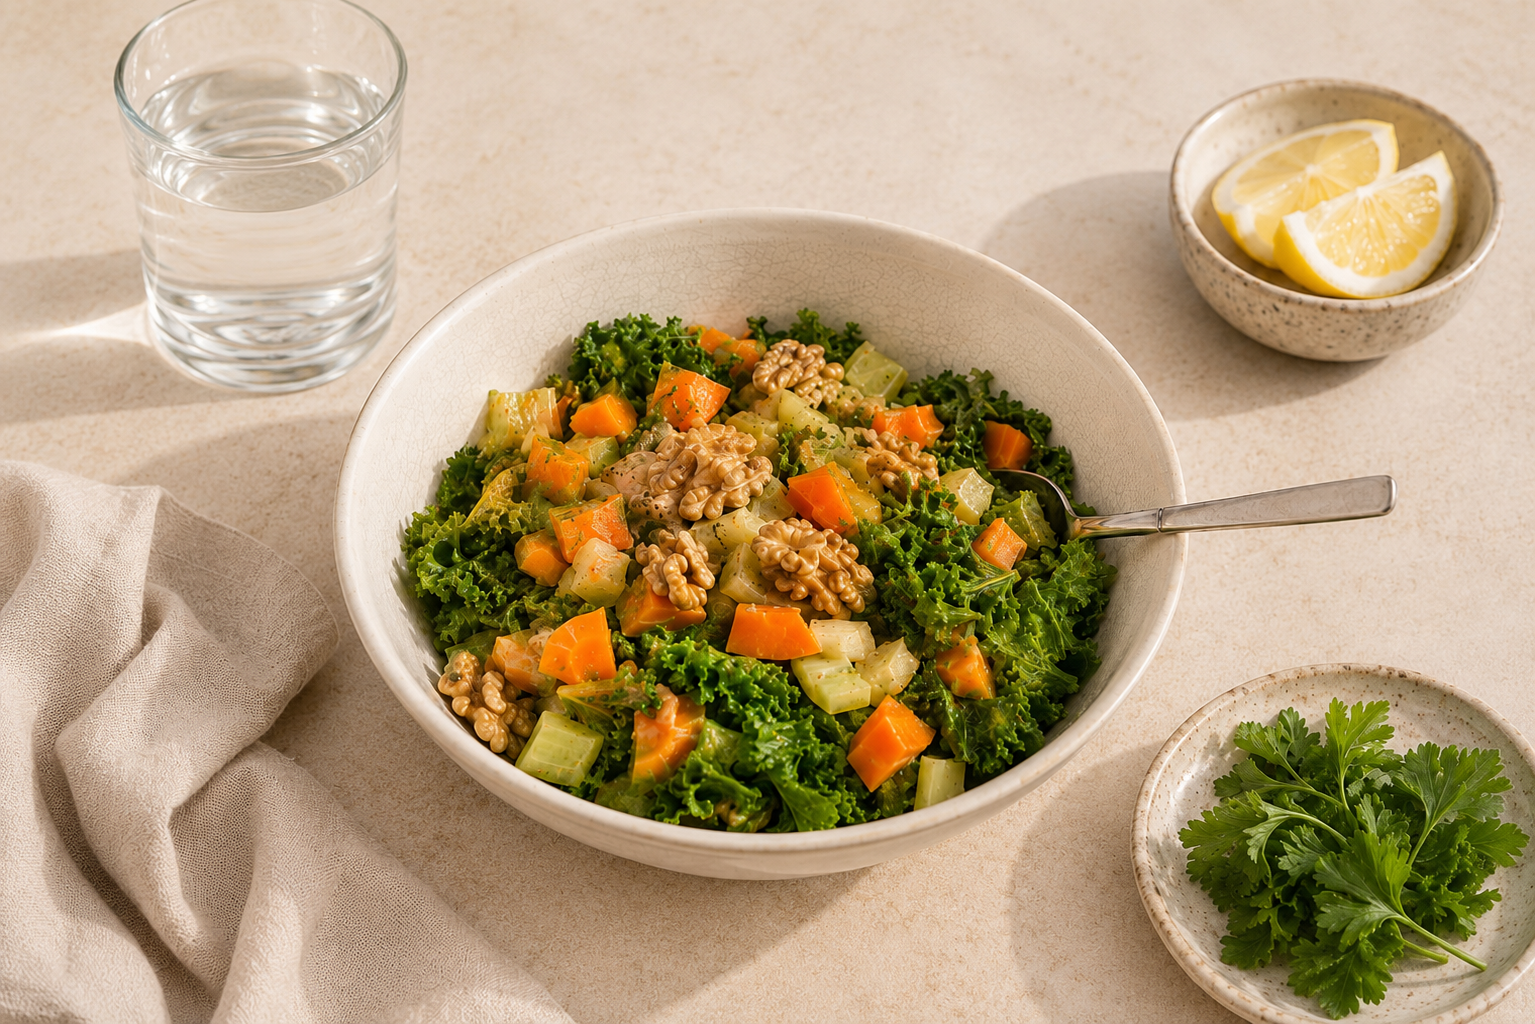
Paleo Keto Salmon Kale and Avocado Salad
Most people look at food and ask one question: How many calories does it contain?
I prefer to ask a different question: What comes packaged with those calories?
Ingredients
100g organic kale
35g celery
½ avocado
105g wild salmon with edible bones
1 small carrot
3 cherry tomatoes
Fresh parsley
Fresh oregano
A handful of walnuts
1 tablespoon organic tahini
Extra virgin olive oil
Lemon juice
Vinegar
Sea salt
At first glance it looks like a simple salad. Nutritionally, however, it is something very different.
The Nutrient Density Test
One of the simplest ways to assess a meal is to compare it against a popular alternative.
Let's compare this salad with a typical McDonald's Big Mac and medium fries.
| Nutrient | Salmon & Kale Salad | Big Mac + Medium Fries |
|---|---|---|
| Calories | 680 kcal | 844 kcal |
| Protein | 37 g | 32 g |
| Total Carbohydrates | 33 g | 84 g |
| Fibre | 15 g | 7 g |
| Net Carbohydrates | 18 g | 77 g |
| Total Fat | 47 g | 41 g |
| Omega-3 Fats | 3.5–4.5 g | Trace amounts |
| Calcium | 450–550 mg | ~180 mg |
| Potassium | 1,600–2,000 mg | ~900 mg |
| Vitamin K | 600–800% DV | 0–10% DV |
| Vitamin C | 180–220% DV | ~15% DV |
| Vitamin A | 120–150% DV | ~10% DV |
| Magnesium | 35–45% DV | ~10% DV |
| Selenium | 90–120% DV | ~40% DV |
The protein content is remarkably similar. Everything else is not.
The salad provides substantially more fibre, calcium, potassium, magnesium, vitamin K, vitamin C, antioxidants and omega-3 fats while containing fewer calories overall.
Why These Ingredients Matter
The salmon contributes:
High-quality protein
EPA and DHA omega-3 fatty acids
Calcium from edible bones
Selenium
Vitamin B12
The kale contributes:
Vitamin K1
Vitamin C
Folate
Potassium
Magnesium
Lutein and zeaxanthin
The avocado contributes:
Monounsaturated fats
Potassium
Fibre
Vitamin E
The tahini contributes:
Calcium
Magnesium
Zinc
Copper
The walnuts contribute:
Plant omega-3 fats (ALA)
Polyphenols
Fibre
Antioxidants
Together these nutrients support cardiovascular health, healthy ageing, exercise recovery, blood sugar regulation, gut health and may support bone health and osteoporosis prevention.
Key nutrients and their sources
| Nutrient | Main Sources in the Salad |
|---|---|
| Protein | Salmon, Tahini |
| Calcium | Salmon Bones, Kale, Tahini |
| Vitamin K | Kale, Parsley, Oregano |
| Vitamin C | Kale, Tomatoes, Lemon Juice |
| Omega-3 Fats | Salmon, Walnuts |
| Potassium | Avocado, Kale, Celery |
| Magnesium | Avocado, Tahini, Walnuts |
| Vitamin E | Avocado, Olive Oil |
| Folate (B9) | Kale, Avocado |
| Selenium | Salmon |
| Zinc | Tahini, Salmon |
| Copper | Tahini, Walnuts |
| Iron | Kale, Tahini, Parsley |
| Fibre | Kale, Avocado, Walnuts, Celery, Carrot |
The Fibre and Whole Food Advantage
One fascinating aspect of nutrition is that calories on a label do not always tell the whole story. Research has shown that whole walnuts provide fewer metabolizable calories than predicted by traditional food labels.
In a controlled feeding study, participants absorbed approximately 21% fewer calories from walnuts than standard Atwater calculations predicted. Scientists believe this occurs because some fats remain trapped within intact plant cell walls and pass through the digestive tract without being fully absorbed.
This highlights an important principle:
Whole foods behave differently from processed foods.
Nutrients interact with fibre, cell structures, digestion and metabolism in ways that food labels cannot fully capture.
Nutritional Breakdown
Standard Nutritional Values
| Nutrient | Amount per Serving |
|---|---|
| Calories | 680 kcal |
| Protein | 37 g |
| Total Carbohydrates | 33 g |
| Fibre | 15 g |
| Net Carbohydrates | 18 g |
| Total Fat | 47 g |
| Saturated Fat | 6 g |
| Monounsaturated Fat | 24 g |
| Polyunsaturated Fat | 12 g |
| Omega-3 Fatty Acids | 3.5–4.5 g |
Estimated Vitamin Content
| Vitamin | Approximate % Daily Value | Main Sources |
|---|---|---|
| Vitamin K | 600–800% | Kale, Parsley, Oregano |
| Vitamin C | 180–220% | Kale, Tomatoes, Lemon Juice |
| Vitamin A | 120–150% | Kale, Carrot |
| Folate (Vitamin B9) | 40–50% | Kale, Avocado |
| Vitamin E | 30–40% | Avocado, Olive Oil |
| Vitamin B12 | 250–350% | Salmon |
| Vitamin B6 | 25–35% | Salmon, Avocado |
| Vitamin D | 15–25% | Salmon |
Estimated Mineral Content
| Mineral | Approximate % Daily Value | Main Sources |
|---|---|---|
| Calcium | 45–55% | Salmon Bones, Kale, Tahini |
| Magnesium | 35–45% | Avocado, Tahini, Walnuts |
| Potassium | 35–45% | Avocado, Kale, Celery |
| Phosphorus | 50–60% | Salmon, Tahini |
| Selenium | 90–120% | Salmon |
| Zinc | 15–20% | Tahini, Salmon |
| Copper | 40–60% | Tahini, Walnuts |
| Iron | 15–20% | Kale, Tahini, Parsley |
| Manganese | 25–35% | Kale, Walnuts, Tahini |
Looking Beyond Calories
Traditional nutrition labels calculate this meal at approximately:
680 calories
Removing fibre calories:
15g fibre × 4 kcal = 60 kcal
Adjusted calories: 620 kcal
Some Paleo and Keto practitioners also argue that healthy fats have a different metabolic effect from refined carbohydrates because they produce greater satiety, smaller insulin responses and may reduce overall food intake.
If calories from dietary fat are excluded for comparison purposes:
47g fat × 9 kcal = 423 kcal
Calories remaining from protein and digestible carbohydrates:
197 kcal
Comparison of Different Calculations
| Calculation Method | Calories | Explanation |
|---|---|---|
| Standard Nutritional Calculation | 680 kcal | Total calories using conventional food label calculations. |
| Minus Fibre Calories | 620 kcal | Removes calories attributed to 15g of fibre (15 × 4 kcal). |
| Protein & Net-Carbohydrate Energy Only | 197 kcal | A Paleo-Keto interpretation showing calories from protein and digestible carbohydrates only. |
Scientific Note
The standard nutritional calculation remains the most scientifically accepted measure of available energy.
The fibre-adjusted and fat-adjusted calculations are included as conceptual models often discussed within Paleo and Keto nutrition communities.
Dietary fat still provides usable energy and should not be considered calorie-free.
However, protein, fibre and whole-food structures do influence digestion, satiety, nutrient absorption and energy availability in ways that simple calorie counts cannot fully describe.
For this reason, focusing solely on calories may miss an important part of the nutritional picture.
Nutrient Density Scorecard
The following scorecard provides a simple visual comparison between the nutritional quality of the salmon and kale salad and a typical fast-food meal.
| Health Category | Salmon & Kale Salad | Big Mac + Medium Fries |
|---|---|---|
| Protein Quality | Excellent | Good |
| Fibre Content | Excellent | Moderate |
| Omega-3 Fats | Excellent | Poor |
| Calcium Content | Excellent | Poor |
| Vitamin K | Excellent | Poor |
| Potassium | Excellent | Moderate |
| Micronutrient Density | Excellent | Moderate |
| Food Processing | Minimal | Highly Processed |
| Satiety | High | Moderate |
| Blood Sugar Impact | Low | High |
| Support for Bone Health | Excellent | Poor |
| Support for Weight Management | Excellent | Moderate |
| Overall Nutrient Density | Excellent | Moderate |
Final Thoughts
Could I have eaten a Big Mac and fries?
Absolutely.
Would I have consumed a similar amount of protein?
Yes.
Would I have consumed anything close to the same amount of vitamins, minerals, omega-3 fats, fibre and nutrient density?
Not even close.
For fewer calories, substantially more micronutrients, more fibre, more omega-3 fats and a richer nutritional profile overall, the salmon and kale salad wins comfortably.
Sometimes healthy eating isn't about eating less. It's about choosing foods that give your body more of what it actually needs.
References
1. Walnuts Provide Fewer Metabolisable Calories Than Predicted
Baer DJ, Gebauer SK, Novotny JA.
Walnuts Consumed by Healthy Adults Provide Less Available Energy than Predicted by the Atwater Factors.
The Journal of Nutrition. 2016;146(1):9–13.
DOI: 10.3945/jn.115.217497
Article:
https://academic.oup.com/jn/article/146/1/9/4584761
PubMed:
https://pubmed.ncbi.nlm.nih.gov/26677215/
2. Energy Availability of Nuts and Calorie Absorption
Novotny JA, Gebauer SK, Baer DJ.
Discrepancy between the Atwater Factor Predicted and Empirically Measured Energy Values of Nuts.
American Journal of Clinical Nutrition. 2012;96(2):296–301.
DOI: 10.3945/ajcn.112.035782
Article:
https://academic.oup.com/ajcn/article/96/2/296/4577167
PubMed:
https://pubmed.ncbi.nlm.nih.gov/22760558/
Scientific Disclaimer
Nutritional values presented in this article are estimates based on standard food composition databases and published literature.
The "alternative calorie calculations" section is included to illustrate concepts commonly discussed within Paleo, Mediterranean and ketogenic nutrition communities. These calculations should not be interpreted as a replacement for standard nutritional science, which recognises that dietary fat remains an important source of usable energy.
Individual nutrient absorption and calorie utilisation vary between people and depend on factors such as digestion, gut microbiome composition, food preparation methods and overall dietary patterns.